Basic IMU Setup and Raw Data Acquisition
Learning Objectives
- Understand IMU fundamentals
- Understand I2C/SPI communication protocols
- Learn coordinate systems and sensor fusion basics
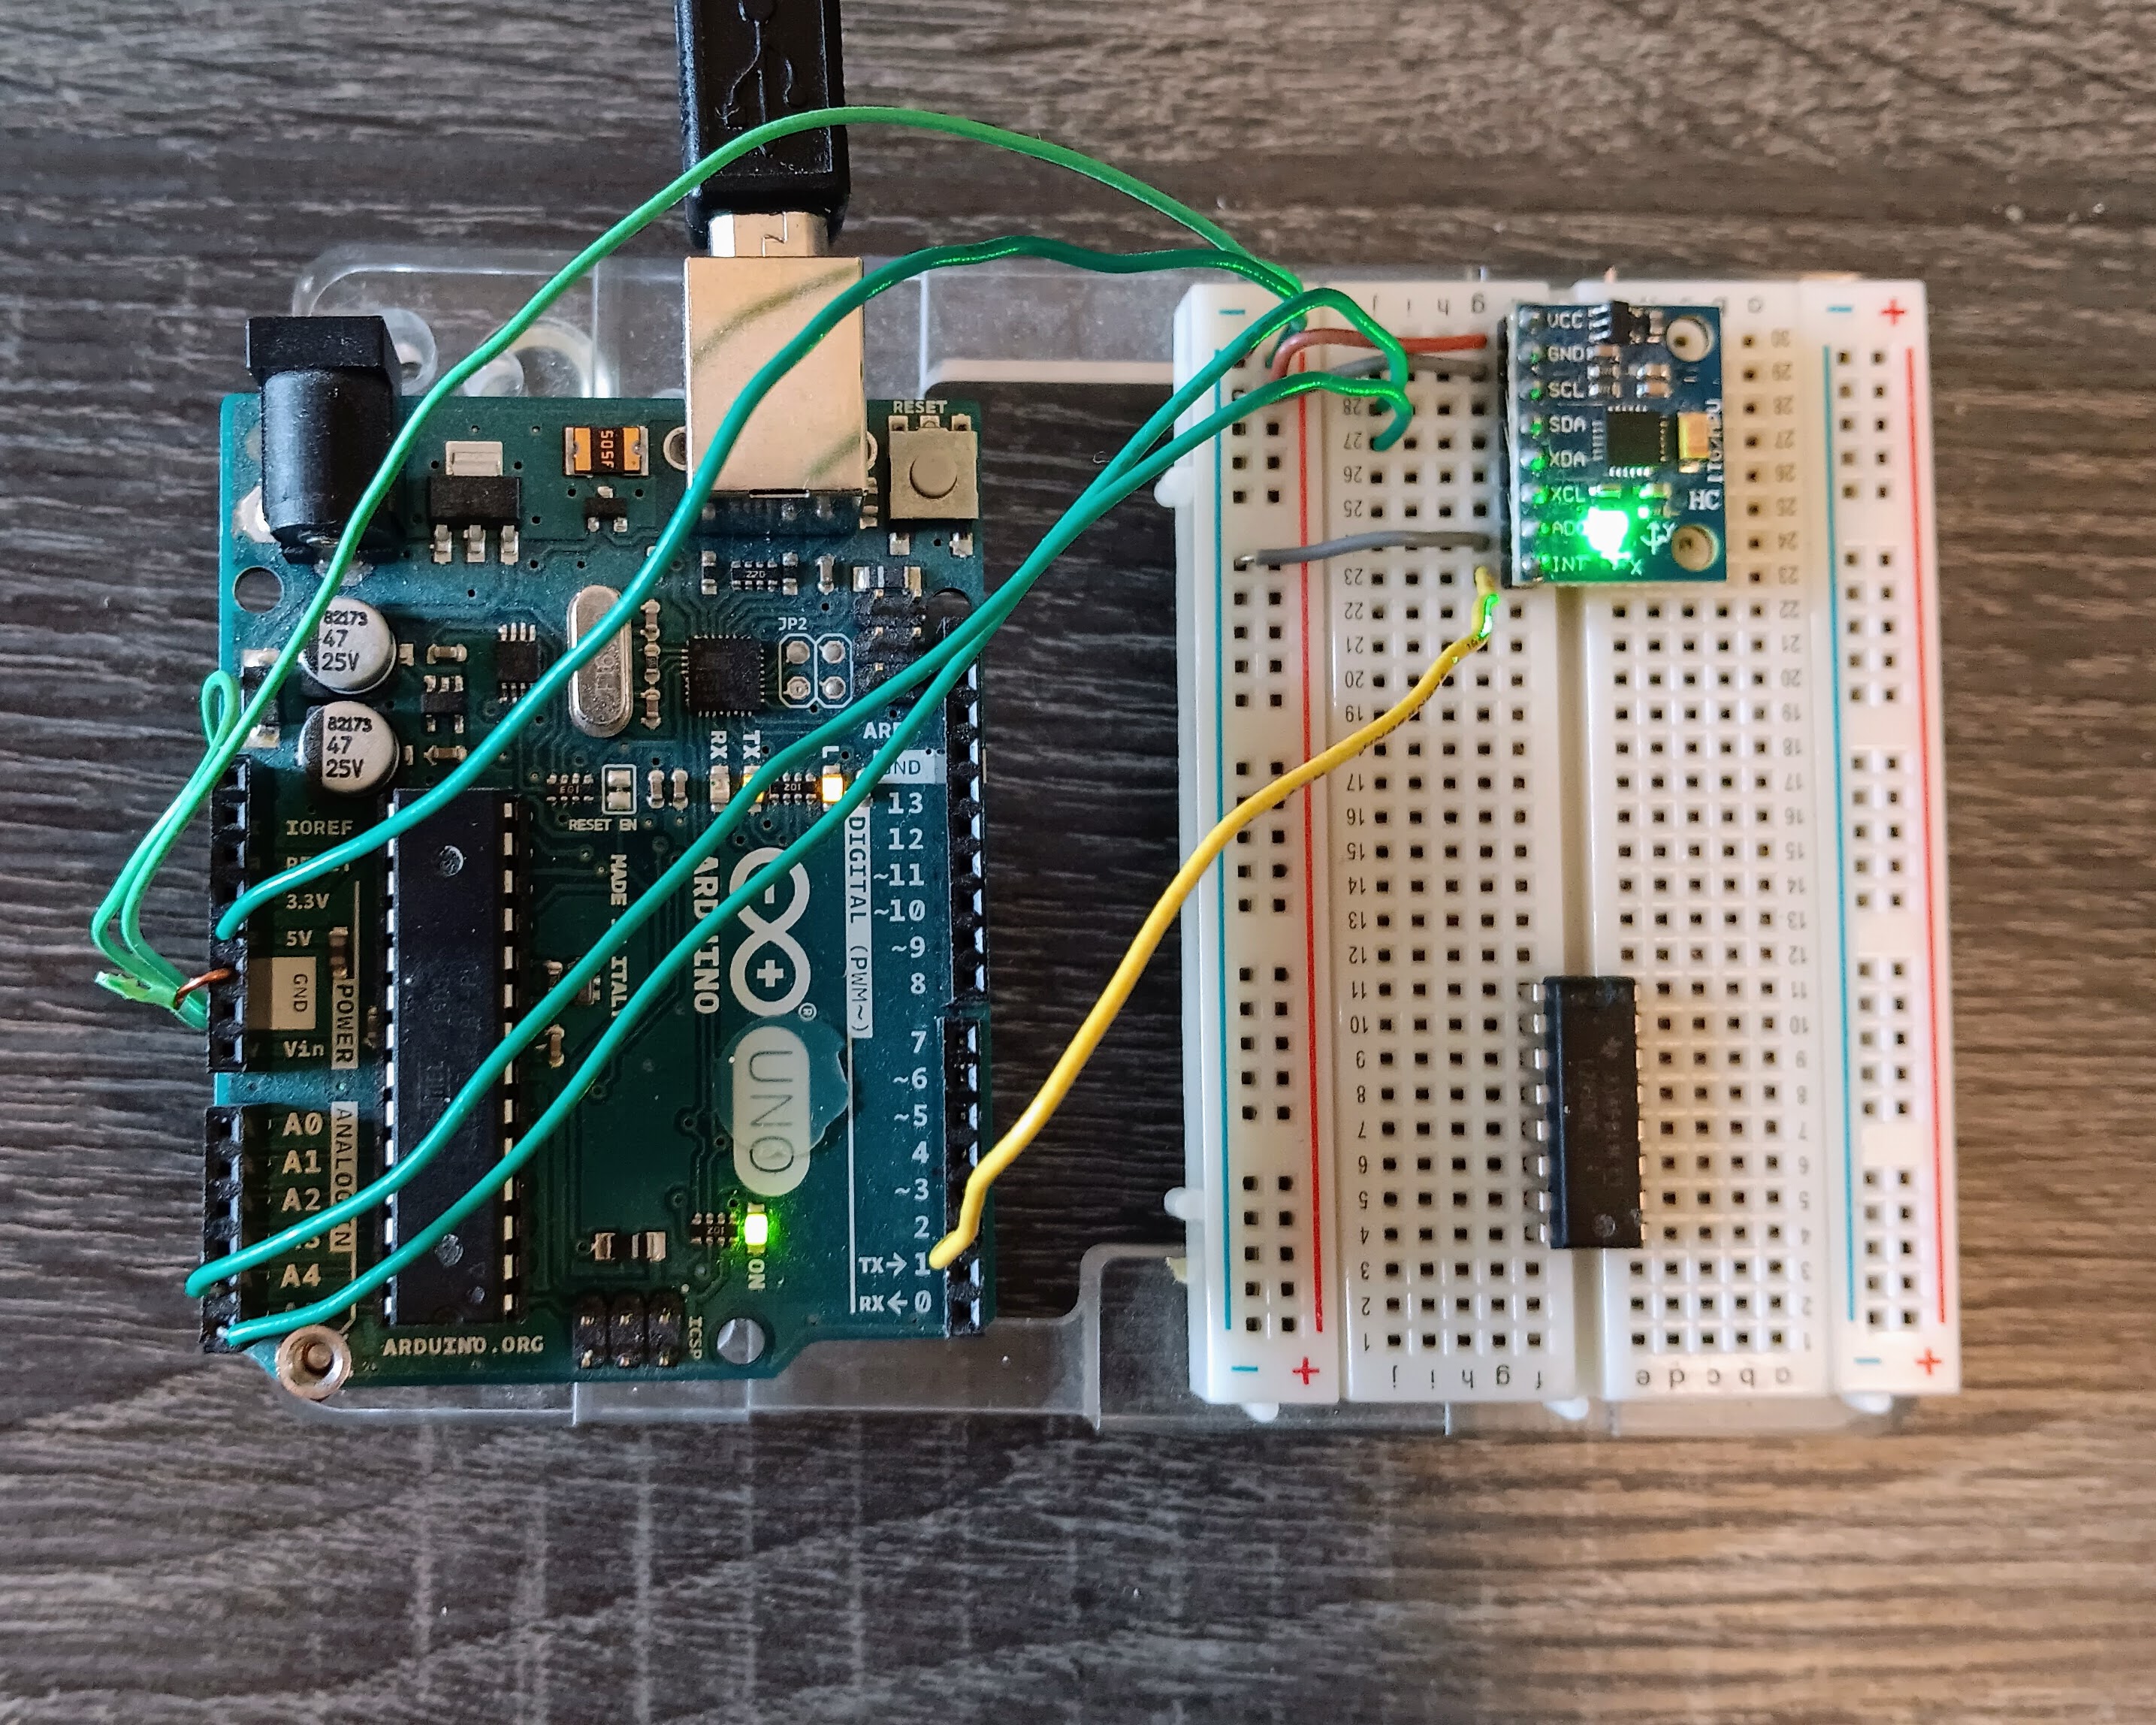
MPU-6050     Arduino Uno
-------------------------
 VCC   ---   3.3V (recommended) or 5V
 GND   ---   GND
 SCL   ---   A5 (SCL)
 SDA   ---   A4 (SDA)
 XDA   ---   (Leave unconnected for now)
 XCL   ---   (Leave unconnected for now)
 AD0   ---   GND (sets I2C address to 0x68)
 INT   ---   Digital Pin 2 (optional, for interrupts)
Create the following sketch for the Arduino Uno to perform basic connection test to the MPU-6050:
#include <Wire.h>

void setup() {
  Serial.begin(9600);
  Wire.begin();
  Serial.println("Scanning for I2C devices...");

  // Check if MPU-6050 responds at address 0x68
  Wire.beginTransmission(0x68);
  if (Wire.endTransmission() == 0) {
    Serial.println("MPU-6050 found at address 0x68!");
  } else {
    Serial.println("MPU-6050 not found. Check wiring.");
  }
}

void loop() {
  // Empty for now
}Wire.h is the Arduino library that handles I2C communication protocol. I2C is a serial communication method that allows multiple devices to communicate using just two wires:
The MPU-6050 IMU communicates with the Arduino using I2C protocol. Instead of having separate wires for each sensor reading, I2C lets us:
These are some of the registers you want to be aware of:
#include <Wire.h>

const int MPU_addr = 0x68;  // this is the address of the MPU
int16_t AcX, AcY, AcZ, Tmp, GyX, GyY, GyZ;

void setup() {

  // initialize the Arduino as I2C Master
  Wire.begin();

  // Start conversation with IMU at the defined address
  Wire.beginTransmission(MPU_addr);
  Wire.write(0x6B);  // PWR_MGMT_1 register
  Wire.write(0);     // Wake up the MPU-6050
  Wire.endTransmission(true);

  // setup the Arduino serial port and print two headers
  Serial.begin(9600);
  Serial.println("Raw IMU Data Reader");
  Serial.println("AcX,AcY,AcZ,GyX,GyY,GyZ");
}

void loop() {
  Wire.beginTransmission(MPU_addr);
  Wire.write(0x3B);  // Starting register for accelerometer
  Wire.endTransmission(false);
  Wire.requestFrom(MPU_addr, 14, true);

  // Read accelerometer data
  /* read the high byte,
     shift left,
     then read the low byte,
     and combine the two with OR operation
  */
  AcX = Wire.read() << 8 | Wire.read();
  AcY = Wire.read() << 8 | Wire.read();
  AcZ = Wire.read() << 8 | Wire.read();

  // Skip temperature for now
  Tmp = Wire.read() << 8 | Wire.read();

  // Read gyroscope data
  GyX = Wire.read() << 8 | Wire.read();
  GyY = Wire.read() << 8 | Wire.read();
  GyZ = Wire.read() << 8 | Wire.read();

  // print each value to serial port
  Serial.print(AcX); Serial.print(",");
  Serial.print(AcY); Serial.print(",");
  Serial.print(AcZ); Serial.print(",");
  Serial.print(GyX); Serial.print(",");
  Serial.print(GyY); Serial.print(",");
  Serial.println(GyZ);

  delay(100);
}The data from the above code would look something like this:
AcX,AcY,AcZ,GyX,GyY,GyZ
468,-48,13088,-131,-29,-34
512,-56,13032,-108,-54,-34
548,-144,13072,-106,-37,-25
572,-100,13056,-112,-23,-43
444,-148,13000,-112,-33,-39
624,-64,12980,-112,-32,-27
496,-48,13016,-90,-29,-47
600,-112,13116,-103,-34,-30
488,-104,13076,-105,-26,-22At the default ±2g range:
At the dafault ±250°/s range:
#include <Wire.h>

const int MPU_addr = 0x68;  // this is the address of the MPU
int16_t AcX, AcY, AcZ, Tmp, GyX, GyY, GyZ;

// scaling factors
const float accel_scale = 16384.0;  // LSB/g for ±2g range
const float gyro_scale = 131.0;     // LSB/(°/s) for ±250°/s range

void setup() {

  // initialize the Arduino as I2C Master
  Wire.begin();

  // Start conversation with IMU at the defined address
  Wire.beginTransmission(MPU_addr);
  Wire.write(0x6B);  // PWR_MGMT_1 register
  Wire.write(0);     // Wake up the MPU-6050
  Wire.endTransmission(true);

  // setup the Arduino serial port and print two headers
  Serial.begin(9600);
  Serial.println("IMU Data with Physical Units");
  Serial.println("Accel(g): X,Y,Z | Gyro(°/s): X,Y,Z");
}

void loop() {
  readIMU();
  // Convert to physical units
  float ax = AcX / accel_scale;
  float ay = AcY / accel_scale;
  float az = AcZ / accel_scale;

  float gx = GyX / gyro_scale;
  float gy = GyY / gyro_scale;
  float gz = GyZ / gyro_scale;

  // Display data
  Serial.print("A: ");
  Serial.print(ax, 3); Serial.print(",");
  Serial.print(ay, 3); Serial.print(",");
  Serial.print(az, 3);
  Serial.print(" | G: ");
  Serial.print(gx, 2); Serial.print(",");
  Serial.print(gy, 2); Serial.print(",");
  Serial.println(gz, 2);

  delay(100);  // value in msec
}

void readIMU() {
  Wire.beginTransmission(MPU_addr);
  Wire.write(0x3B);  // Starting register for accelerometer
  Wire.endTransmission(false);
  Wire.requestFrom(MPU_addr, 14, true);

  // Read accelerometer data
  /* read the high byte,
     shift left,
     then read the low byte,
     and combine the two with OR operation
  */
  AcX = Wire.read() << 8 | Wire.read();
  AcY = Wire.read() << 8 | Wire.read();
  AcZ = Wire.read() << 8 | Wire.read();

  // Skip temperature for now
  Tmp = Wire.read() << 8 | Wire.read();

  // Read gyroscope data
  GyX = Wire.read() << 8 | Wire.read();
  GyY = Wire.read() << 8 | Wire.read();
  GyZ = Wire.read() << 8 | Wire.read();
}The output data would look something like the following:
Raw IMU Data Reader
AcX,AcY,AcZ,GyX,GyY,GyZ
A: 0.007,0.012,0.800 | G: -0.75,-0.40,-0.16
A: 0.016,0.010,0.805 | G: -0.89,-0.32,-0.15
A: 0.010,0.017,0.798 | G: -0.82,-0.08,-0.26
A: 0.000,0.017,0.790 | G: -0.66,-0.21,-0.16
A: 0.010,0.015,0.790 | G: -0.77,-0.52,-0.22
A: 0.014,0.010,0.797 | G: -0.82,-0.28,-0.16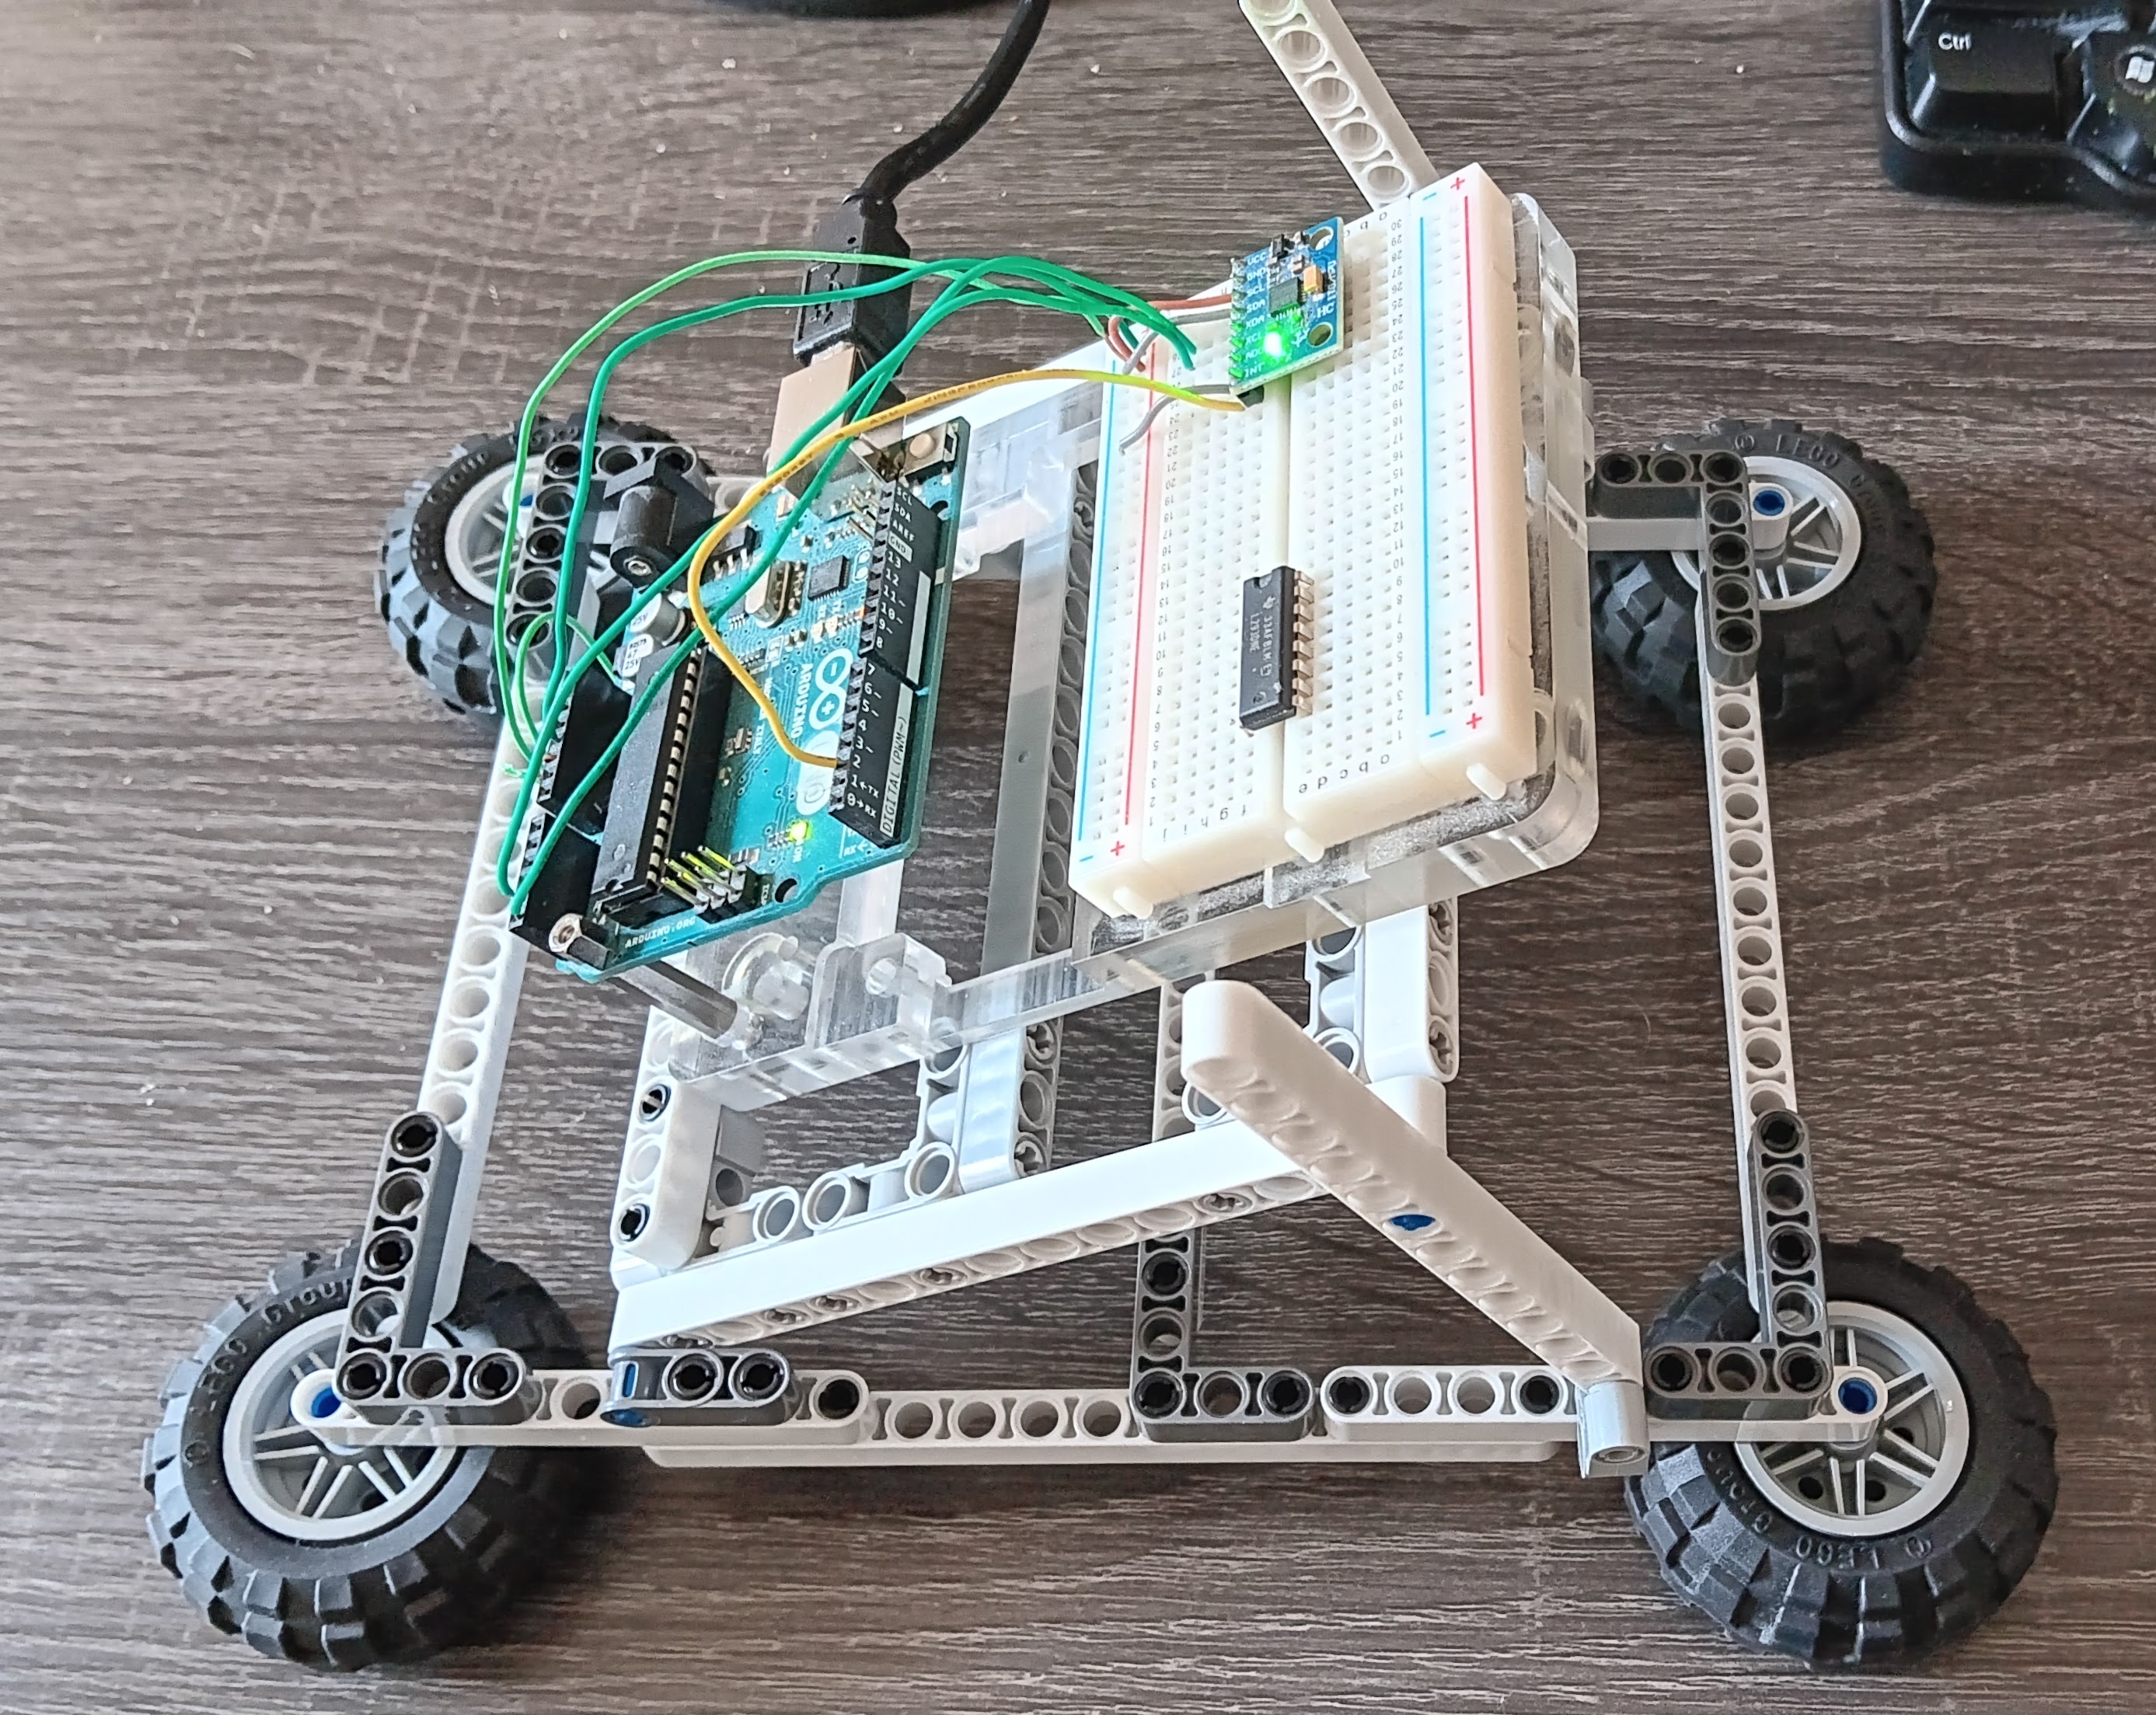
A: -0.002,0.010,0.800 | G: -0.80,-0.27,-0.15I built a contraption out of Lego, to test the IMU in different positions. The first version (see picture) pivots the sensor on one axis, which would enable me to test the sensor data at different angles. Since the contraption does not provide any measurement, I’m going to use a compass to capture approximate angles during my experimentation.
 >
>
The IMU on the breadboard is lying as flat as possible, and where:
The data is not filtered. I'm presenting four lines of printout on the Arduino Serial Monitor.
IMU Data with Physical Units
Accel(g): X,Y,Z | Gyro(°/s): X,Y,Z
A: 0.021,0.013,0.789 | G: -0.66,-0.32,-0.17
A: 0.012,0.015,0.794 | G: -0.68,-0.47,-0.32
A: 0.013,0.010,0.789 | G: -0.50,-0.28,-0.27
A: 0.015,0.012,0.799 | G: -0.44,-0.27,-0.28IMU Data with Physical Units
Accel(g): X,Y,Z | Gyro(°/s): X,Y,Z
A: 0.689,0.001,0.556 | G: -0.59,-0.28,-0.14
A: 0.688,0.003,0.557 | G: -0.60,-0.50,-0.31
A: 0.688,0.007,0.551 | G: -0.76,-0.42,-0.24
A: 0.691,-0.004,0.563 | G: -0.72,-0.46,-0.21IMU Data with Physical Units
Accel(g): X,Y,Z | Gyro(°/s): X,Y,Z
A: 0.095,0.526,0.633 | G: -0.62,-0.40,-0.28
A: 0.095,0.521,0.634 | G: -0.76,-0.44,-0.08
A: 0.102,0.526,0.642 | G: -0.77,-0.40,-0.24
A: 0.097,0.526,0.641 | G: -0.59,-0.50,-0.31IMU Data with Physical Units
Accel(g): X,Y,Z | Gyro(°/s): X,Y,Z
A: -0.813,0.535,-0.256 | G: -0.50,-0.06,-0.21
A: -0.813,0.539,-0.259 | G: -0.51,0.29,-0.22
A: -0.806,0.538,-0.264 | G: -0.79,-0.28,0.08
A: -0.813,0.531,-0.265 | G: -0.84,-0.37,-0.11A: 0.043,0.011,0.794 | G: -0.66,-0.15,-0.28
A: 0.045,0.013,0.791 | G: -0.54,-0.41,-0.27
A: 0.045,0.016,0.792 | G: -0.59,-0.40,-0.50
A: 0.044,0.008,0.784 | G: -0.80,-0.30,-0.23A: 0.244,0.009,0.783 | G: -0.76,-0.42,-0.18
A: 0.240,0.001,0.774 | G: -0.52,-0.51,-0.13
A: 0.236,0.009,0.771 | G: -0.78,-0.34,-0.34
A: 0.247,0.004,0.773 | G: -0.53,-0.48,-0.34A: 0.532,-0.007,0.660 | G: -0.58,-0.41,-0.34
A: 0.530,-0.005,0.659 | G: -0.63,-0.30,-0.22
A: 0.533,-0.011,0.656 | G: -0.64,-0.28,-0.24
A: 0.522,-0.007,0.661 | G: -0.66,-0.54,-0.27A: 0.803,-0.003,0.449 | G: -0.66,-0.44,-0.15
A: 0.805,-0.001,0.443 | G: -0.50,-0.46,-0.02
A: 0.809,-0.007,0.439 | G: -0.57,-0.31,-0.33
A: 0.804,-0.005,0.441 | G: -0.53,-0.34,-0.34I made some changes to the Arduino code to be able to plot the data.
Again, the data presented here is not filtered, although I used the interpolate feature for the Gyroscope plot.
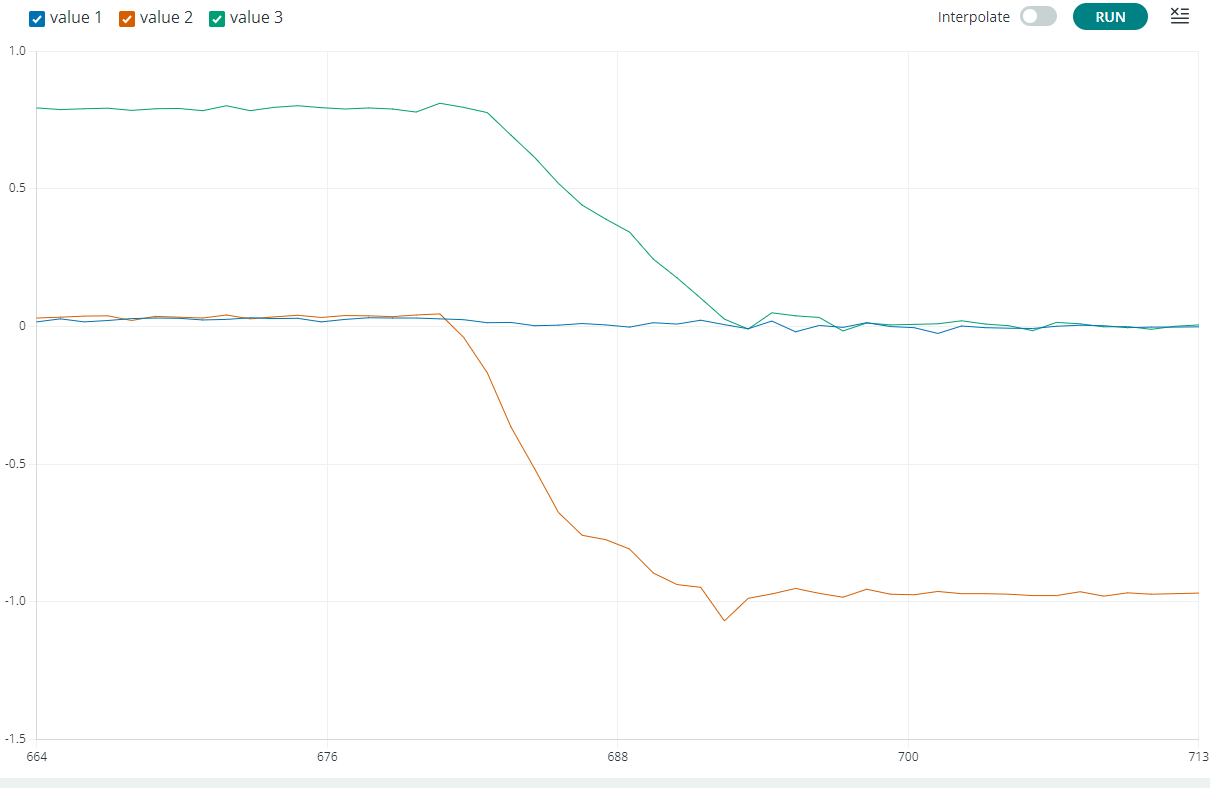
The following is a plot of the Accelerometer data with the MPU rotating from 0 to ~90°
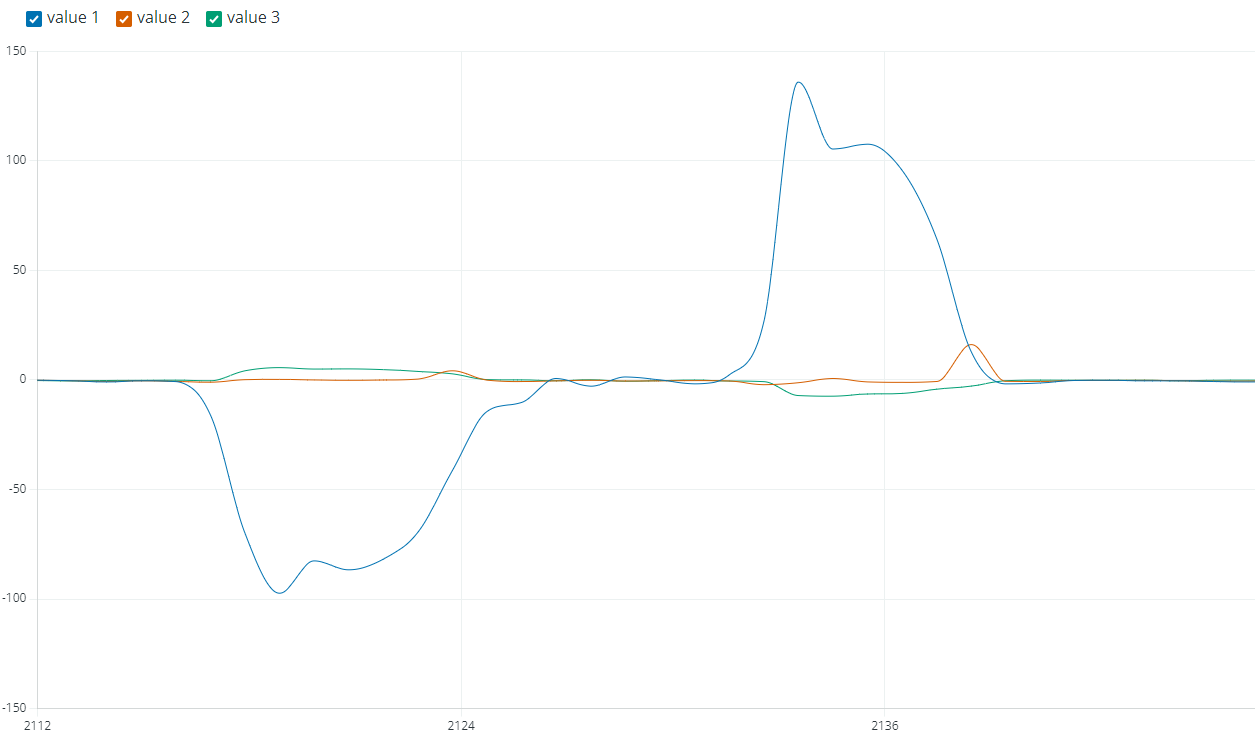
The following is a plot of the Gyroscope data with the MPU rotatin of the MPU rotating from 0° to 90° and the back to 0°.